Saturday, February 1, 2014

First Step: Blocking Buffer Solutions

On Friday (January 31st), I worked on the first steps of my new blocking buffer project! Because I did not specifically explain the purpose of a blocking buffer in my previous posts, blocking buffers are used to prevent nonspecific binding, reduce background signal, and stabilize proteins for better interactions. These effects are demonstrated in the following image.

Image from http://www.immunochemistry.com/products/elisa-solutions-1/blocking-buffers.html

Today I took my first step in my project by making my blocking buffer solutions! We decided to make 5 mL of each BSA solution (5%, 2.5%, 1%, 0.2%) and 10 mL of each Casein solution (1x and 1/2x). First, I had to do the calculations to determine the amounts of the buffers and the amounts of PBS that I would need for the dilutions. First, I would make the highest concentration solution and dilute from that. Below are my calculations.


Once the calculations were confirmed, I completed the dilutions. I have now officially started my own project! I can't wait to carry out this experiment!

Sunday, January 26, 2014

Blocking Buffer Project Introduction

On Friday (January 24th), I worked on planning my project for the Spring semester. I will be testing concentrations of blocking buffers and the time and temperature used for blocking. In my experiments, I will be testing two popular blocking buffers: Bovine Serum Albumin (BSA) and Casein. In my research last week, I found that the concentrations of BSA used in research procedures are usually between 0.2% and 5%, and concentrations of Casein are usually between 1/2x and 1x. Using this information, I decided on a project plan that analyzes 0.2, 1, 2.5, and 5% concentrations of BSA and 1/2x and 1x concentrations of Casein. I will be testing the BSA concentrations at room temperature for blocking times of 30 minutes, 1 hour, and 2 hours, and at 4˚C blocked overnight. I will be testing the Casein concentrations at room temperature and 37˚C for blocking times of 30 minutes, 1 hour, and 2 hours, and at 4˚C overnight. Below shows my initial tables for the project. The last table indicates how many slides I will need for each temperature for each blocking buffer. 


Overall, my goal is to determine the least amount of blocking buffer and the least amount of blocking time that will be effective in blocking the slides. I will collect quantitative data by examining the intensity of fluorescence that results on each slide when each slide is coated with SYPRO dye. Last week, I determined that the SYPRO dye has a pH of 5. This acidity could cause the SYPRO dye to elute protein off of the slides. Ideally, we would like to raise the pH of the dye to 7.4. However, raising the pH can cause the dye to fall out of solution and form a solid. 

Today, I tested the pH that I could raise the SYPRO dye to before it fell out of the solution. To do this, I tested a 1 mL sample of the dye, adding 1 µL of 2M NaOH at a time and spinning the sample down for 1 minutes to observe if any solid formed.


Once I observed a clear, jellylike solid substance forming from the solution, I used pH strips to test the pH of the solution, which I found to be around 6. I then continued to raise the pH of the dye to pH 10 to see if there were any other effects of increasing the pH. I found that there were no effects other than a clear, jelly-like substance forming at the bottom of the sample. We then wanted to know if any of the dye stayed in the solution. To do this, I took small samples of the original dye, the supernatant that was left after I spun down the sample, and the jelly-like substance. JP and I then observed these samples under UV light to observe the fluorescence of the dye. We found that both the jelly-like substance and the supernatant were about half as fluorescent as the original dye.

I can't wait to continue developing the details of my project next week!

Tuesday, January 21, 2014

Lyophilization

Last Friday (January 17th), I returned to RPI to work more with samples from a peptide synthesis. Today, we went through the process of lyophilization, also known as freeze-drying. The peptide samples were from a synthesis that JP completed earlier, which were already frozen in the freezer. To prepare the peptides for lyophilization, we used liquid nitrogen to freeze the peptides and then covered the tubes with both parafilm and foil. We had to poke holes in the foil and parafilm with a thumbtack for the process to work properly. In the process of lyophilization, we use a machine like the one shown below.


In the process of lyophilization, the peptide tubes are placed in a canister that attaches to one of the spouts of the machine. Inside the center pole of the machine, there is an extremely cold coil that's even colder than the liquid nitrogen. This machine applies both force and extremely cold temperatures to the peptides. As the peptides slowly melt, the pressure causes the water vapor to be transferred to the colder coil, where it condenses. After two or three days, this process eventually removes all of the water from the peptide samples, leaving them freeze-dried with the appearance like a dried sponge or old chewing gum. Lyophilization allows us to turn the peptide samples into a powder, which will be used in future experiments with our synthesized peptides.

Today, we also discussed possible topics for a my own research project. My project will likely have to do with testing blocking buffer solutions. My first task was to check the pH of SYPRO protein gel stain to make sure it's not too acidic to use with peptide microarrays. Using pH strips, I found the pH to be approximately 5.


 I will provide more details of my project in coming weeks. This week, I am tasked with researching details about different blocking buffer solutions that are currently in use. I can't wait to establish the objectives of my project!

Saturday, January 11, 2014

Work-Up

Yesterday, (January 10th), I went to RPI for my first research day of the second semester! I worked on a work up of the peptide synthesis I helped prep for in December. First, I swelled the pellets with ethanol to re-saturate them. Then, I washed each well with TFA:DCM using a step pipette to remove blocking groups. This was the first time I've ever used a step pipette! It dispenses a specified amount of liquid without exposing the inside of the pipette to caustic chemicals such as TFA:DCM.


After TFA:DCM was added to each well, I waited 30 minutes for it to drain, then repeated the TFA:DCM wash process two more times. While I waited for the TFA:DCM to drain, I washed slides in ethanol and made 100mL of 20% ethanol.

After the TFA:DCM drained, I washed the wells with DMF three times to remove the TFA:DCM. I then hooked the well plate up to a vacuum and used the vacuum to drain the plate as I washed the wells with ethanol three more times to remove any remaining TFA:DCM and DMF.

Once the washes were complete, I added ethanol to the bottom of the wells as well as on top, so the peptides are kept in ethanol until they are needed.


I can't wait to return and continue my work!

Friday, December 13, 2013

Prepping for Peptide Synthesis

Today, (December 13th), I went to RPI for my final research day of the first semester! Today I worked on prepping for another peptide synthesis. We are working to attach a peptide to a new linker that attaches to a resin bead. The concept is similar to another idea that I introduced in a previous post. These beads will eventually be packed into a column and used to purify biologics with the binding of the peptides on the beads.

My first job was to make 25 mL of 0.1 M NaOH from 2 M NaOH. Using the formula (M1)(V1)=(M2)(V2), I found that I would need to add 1.25 mL of 2 M NaOH and fill the rest of the volume with PBS. To carry out the dilution, I used a volumetric flask.


Next, I made 50 mL of 20% ethanol solution. To do this, I added 10 mL of ethanol to 40 mL of distilled water. After I mixed this solution, I then added 150 microliters to each of 20 wells in a well plate. After waiting for half an hour for the ethanol solution to evaporate, I added 150 more microliters to each well.


I can't believe that the first semester of my senior year is already over! I can't wait to see what's in store for me starting in January.


Sunday, December 8, 2013

New Microarray Experiment

On Friday (December 6th), I finally returned to RPI! JP explained to me a new experiment that we're running. We are now running a microarray to analyze the binding of HCP proteins that we do not want to bind to the biologic that we are creating. This information will be used in the purification work I described in an earlier post.

Today, most of my time was spent waiting for the microarray slides to incubate (they had to incubate for an entire two hours!). While I waited, Doug and I adjusted the pH of the PBS he was making using a 1M NaOH solution to increase the pH to 5.5.  I then labeled the tubes for HCP and PBS solutions and the petri dishes containing the slides that would eventually be used with those solutions. Some tubes would contain 1 mL of PBS, some would contain 1 mL of HCP solution, and some would contain a mixture of half PBS and half HCP solution. After I finished labeling, I added the indicated amounts of PBS and HCP solution to the tubes.

After the tubes were all filled, Doug and I made amino acid solutions. After some practice, I'm definitely getting faster at weighing out the amino acids!


When the slides were finally done incubating, we washed them three times with the new PBS solution for 10 minutes per wash. By the time the washes were over, it was time for me to go back to Emma!

I can't wait to return to RPI next week for my last visit of the semester and see the results of this experiment!

Sunday, December 1, 2013

Scanning Slides

Last Friday (November 22nd), I returned to RPI for more work! Currently, we have three methods of getting the protein that we are focusing on. The first method involves growing the protein in E-coli and lysing the cells. The other two methods involve extracting the protein from human brain cells using different buffers (which I will call buffer R and buffer T). As I have demonstrated in previous 
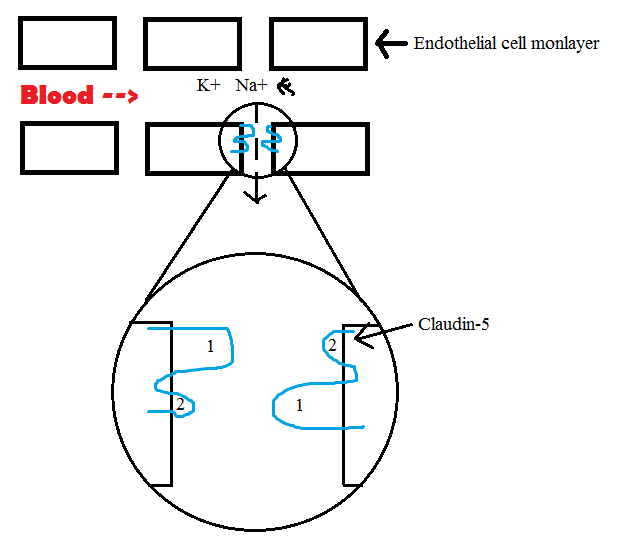
posts, our protein consists of two loops that react with each other to form a tight junction.


In all of our previous experiments, we have used only parts of the protein in microarray experiments. Today, we analyzed microarray slides that tested the entirety of the protein for the first time. We used a scanner to analyze slides that tested protein derived from each of the three methods. We scanned nine slides total. 100%, 50%, 10%, and 1% dilution for the E.Coli protein, 50% and 10% dilution for the buffer R protein, and 50% and 10% dilution for the buffer T protein. We scanned each group separately for comparison. With each group, we also scanned a control slide which consisted of no focus protein- only primary antibody- to make sure the antibody was binding specifically to the focus protein. Examples of good and bad binding of the primary antibody are seen below. The blue circles represent focus protein that was bound to the microarray, and the red represents primary antibody. We want the primary antibody to bind only to the focus protein.


For the scan, I laid each slide face down on the scanner, each oriented the same direction. I had to be careful to line them up straight right along the edge of the scanner, so later analysis using spotfinder would be easier to line up the microarray spots. 


An example slide arrangement is seen below for the E.coli slides. 
We scanned the slides first at 200 microns, then at 50 to get the most precise scan possible. After getting the images from the scanner, we imported them into a program called spotfinder to analyze the intensity of each spot. The resulting data wasn't perfect, but it was a good start! 

I will not be able to go to RPI next Friday (November 29th) due to the Thanksgiving holiday, but I look forward to returning on December 6th!