
Tuesday, May 13, 2014
Reflection
I can't believe this is my final blog post! My experience working in the lab at RPI with Dr. Karande and JP Trasatti for the last two years has been one of the most influential experiences of my life. I have had the opportunity to work on parts of the broader blood-brain barrier project as well as on my own focused blocking buffer solution project. Throughout the last two years, I have been able to learn a wide range of different skills and processes and learn a lot about biochemistry. Having my own project within the lab was especially fun because I got to plan the details of my own project and carry out all the tasks from preparation to procedure to analysis of the results. Looking back, I can't imagine my high school experience without research. The skills I have learned in the lab have crossed over into my academic classes, and doing research has allowed me to expand my learning outside the classroom. The people I have worked with in the lab have been invaluable mentors for me as I have prepared to transition from high school to college and considered what I would like to do in the future. Although work in the lab is very different from regular schoolwork, original research has quickly become something that is of utmost importance to me as I continue my academic career in college and beyond. In fact, my research at RPI has already helped me get a research grant at Washington University in Saint Louis, where I will start in the fall. I'd like to give heartfelt thanks to everyone involved in making my two years in the lab such an incredible experience.

Tuesday, April 29, 2014
Blocking Buffer Results!
Last Friday (April 25th), I finally analyzed my results from the room temperature and 37C runs of my blocking buffer experiment!! First, I took pictures of all of the slides in groups of same blocking temperature and same blocking time. To quantify the results of this experiment, the slides were scanned for fluorescence with a 488nm laser. This imaging resulted in the images below, in which the shading of the slides are actually inverted, i.e. the darkest slide in this image is actually the lightest slide.
The resulting images were then analyzed for mean intensity of each slide using a program called ImageJ. This data was then adjusted to account for the inversion of the images and the background noise of the control slide. The following images show graphical representations of the mean intensity/slide area, where intensity indicates lack of dye, or the amount of protein bound to the slide.


From this data, the optimal blocking conditions for BSA are 2.% for 1 hour at room temperature. There is a general trend for BSA that the amount of protein bound for a given temperature and time period is maximized at 2.5% BSA and decreases for 5% BSA. The only exception to that trend is this trial was the 37C 1 hour data, which may be due to splotching on the slide affecting the mean intensity measurement. The optimal blocking conditions for casein are 1x for 2 hours at room temperature. The amount of casein bound increases with concentration at all time periods at room temperature. Casein does not bind to the slide at 37C.
I can't wait to present my work to the Emma community at the student achievement assembly on April 30th!
 |
| Scanner image for room temperature slides |
 |
| Scanner image for 37C Slides |
The resulting images were then analyzed for mean intensity of each slide using a program called ImageJ. This data was then adjusted to account for the inversion of the images and the background noise of the control slide. The following images show graphical representations of the mean intensity/slide area, where intensity indicates lack of dye, or the amount of protein bound to the slide.
From this data, the optimal blocking conditions for BSA are 2.% for 1 hour at room temperature. There is a general trend for BSA that the amount of protein bound for a given temperature and time period is maximized at 2.5% BSA and decreases for 5% BSA. The only exception to that trend is this trial was the 37C 1 hour data, which may be due to splotching on the slide affecting the mean intensity measurement. The optimal blocking conditions for casein are 1x for 2 hours at room temperature. The amount of casein bound increases with concentration at all time periods at room temperature. Casein does not bind to the slide at 37C.
I can't wait to present my work to the Emma community at the student achievement assembly on April 30th!
Saturday, April 12, 2014
Blocking Buffer 37C Phase
On Friday (April 11th), I ran the second phase of my blocking buffer experiment! This consisted of blocking each solution at an incubation temperature of 37˚C. Due to a lack of cut slides, I slightly modified the solutions for this run. For this phase, I used 1/2x and 1x casein at 30 minute and 1 hour blocking times and 0.2%, 2.5%, and 5% BSA at 30 minute and 1 hour blocking times. I gathered all of my materials and went to the 37˚C room down the hall.

For this phase, I used the same protocol from the room temperature phase I ran on February 28th, as seen below.
1) Add 1mL of the specified protein solution to the specified slide.
2) Block on the shaker for the specified time.
3) Drain well with pipette into waste container.
4) Wash slide with 4 mL PBS for 5 minutes.
5) Drain well with pipette into waste container.
6) Transfer slide to new plate.
7) Stain with 4 mL blue stain for 15 minutes.
8) Drain stain into waste.
9) Wash slide with 4 mL PBS for 5 minutes.
10) Air dry slides for 5 minutes on paper towel.
11) Write blocking solution, blocking time, and temperature on back of slides.
I will be away on college trips next week, so I will not be able to go to the lab Friday April 28th. I look forward to imaging the slides from this phase when I get back to the lab on April 25th!
For this phase, I used the same protocol from the room temperature phase I ran on February 28th, as seen below.
1) Add 1mL of the specified protein solution to the specified slide.
2) Block on the shaker for the specified time.
3) Drain well with pipette into waste container.
4) Wash slide with 4 mL PBS for 5 minutes.
5) Drain well with pipette into waste container.
6) Transfer slide to new plate.
7) Stain with 4 mL blue stain for 15 minutes.
8) Drain stain into waste.
9) Wash slide with 4 mL PBS for 5 minutes.
10) Air dry slides for 5 minutes on paper towel.
11) Write blocking solution, blocking time, and temperature on back of slides.
I will be away on college trips next week, so I will not be able to go to the lab Friday April 28th. I look forward to imaging the slides from this phase when I get back to the lab on April 25th!
Sunday, April 6, 2014
Back to the Lab!
On Friday (April 4th), I finally returned to the lab at RPI after a month of break! Today I took a break from my project to get some experience with MALDI. MALDI is matrix-assisted laser desorption/ionization. This process uses mass/charge ratio of ions to see if a peptide was synthesized correctly. First, I put peptides in solution by adding 100 microliters of acetonitrile-water mixture to each of the six sample. I then added 10 microliters of CHCA and 10 microliters of peptide solution to smaller vials.

We then spotted 1 microliter spots onto a steel MALDI plate. Spots A1 and B1 were CHCA and standards, spots A2 and B2 were sample one, spots A3 and B3 were sample 2, etc.

In the MALDI machine, a laser is used to strike a small area of the sample spot. The sample then ionizes into gases. In the system we are using, differently charged plates serve to shoot the ions down the tube, where there are other differently charged plates at the end. Depending on the size and charge of the ions, the ions go different distances into the field of plates at the end of the tube before they are reflected back towards the reflection detector. Because larger ions go deeper into the end plate area, they take longer to get back to the detector, and the detector can give information about the mass/charge ratio of the ions. This process can be seen in the diagram below.
To shoot the laser, you first choose a part of the sample to shoot because the laser area is much smaller than the area of the spot. The computer program magnifies the sample plate and shows the peptide as white spots within the sample spot. You take multiple samples of each spot to minimize the baseline and increase the signal from the laser.
After finishing the MALDI process, I helped JP check on the brain cell samples and check the CO2 content of the incubator. To check the CO2 level, we used a device that measures the CO2 with a KOH solution. This device attaches to a connector on the incubator with a tube. There is a pump on the tube that you squeeze 18 times to pump a sample of the incubator air into the device. The device is then rotated so the gas combines with the KOH solution. The CO2 dissolves in the KOH solution, increasing the volume of the liquid in the device to a measurable level. We want the concentration to be at 5.0 in the incubator, and we found it to be 5.2, so we recalibrated the incubator to decrease the amount of CO2.

We then spotted 1 microliter spots onto a steel MALDI plate. Spots A1 and B1 were CHCA and standards, spots A2 and B2 were sample one, spots A3 and B3 were sample 2, etc.
In the MALDI machine, a laser is used to strike a small area of the sample spot. The sample then ionizes into gases. In the system we are using, differently charged plates serve to shoot the ions down the tube, where there are other differently charged plates at the end. Depending on the size and charge of the ions, the ions go different distances into the field of plates at the end of the tube before they are reflected back towards the reflection detector. Because larger ions go deeper into the end plate area, they take longer to get back to the detector, and the detector can give information about the mass/charge ratio of the ions. This process can be seen in the diagram below.
 |
| Image by JP Trasatti, 4/4/2014 |
After finishing the MALDI process, I helped JP check on the brain cell samples and check the CO2 content of the incubator. To check the CO2 level, we used a device that measures the CO2 with a KOH solution. This device attaches to a connector on the incubator with a tube. There is a pump on the tube that you squeeze 18 times to pump a sample of the incubator air into the device. The device is then rotated so the gas combines with the KOH solution. The CO2 dissolves in the KOH solution, increasing the volume of the liquid in the device to a measurable level. We want the concentration to be at 5.0 in the incubator, and we found it to be 5.2, so we recalibrated the incubator to decrease the amount of CO2.
Friday, March 21, 2014
Missed Weeks
Last Friday (March 14th), my mentor was on spring break, so I did not go to RPI. For the next two weeks (March 21st and March 28th), I will be on spring break, so I will not be going to the lab. I look forward to returning on April 4th!
Sunday, March 9, 2014
Imaging Room Temperature Slides
On Friday (March 7th), I took images of the slides from my room temperature experiment from last week! I started by taking white light pictures with my phone. I took one image per blocking time, with each concentration labeled. I also included the control slide in each image, which was blocked with PBS for 2 hours. Here are the resulting images.


The staining was opposite of what we initially expected- the lowest concentrations were stained darkest.
After finishing the white light images, I went down to the flatbed scanner to scan the slides. Even though this dye does not really fluoresce, we scanned them for fluorescence anyway to get images. Each column on the scanner corresponded to a certain time, with the concentration increases up the column.

In the resulting image, the darkest-stained slides turned out as the lightest when they were scanned, so we had to invert the resulting images, so the darkest-stained slides show as the darkest. I will eventually use these scanned images to evaluate the darkness of each slide in pixels to quantify what is otherwise qualitative data. This imaging will be the data to take away from the experiment as a whole, to determine the blocking buffer, time and temperature that will maximize blocking efficiency in other experiments.
JP is on spring break next week, and then I am on spring break for the two following weeks, so I will not be able to return to RPI until April 4th. I can't wait to get started on the next phase of my project, which will be the 37C experiment!
The staining was opposite of what we initially expected- the lowest concentrations were stained darkest.
After finishing the white light images, I went down to the flatbed scanner to scan the slides. Even though this dye does not really fluoresce, we scanned them for fluorescence anyway to get images. Each column on the scanner corresponded to a certain time, with the concentration increases up the column.
In the resulting image, the darkest-stained slides turned out as the lightest when they were scanned, so we had to invert the resulting images, so the darkest-stained slides show as the darkest. I will eventually use these scanned images to evaluate the darkness of each slide in pixels to quantify what is otherwise qualitative data. This imaging will be the data to take away from the experiment as a whole, to determine the blocking buffer, time and temperature that will maximize blocking efficiency in other experiments.
JP is on spring break next week, and then I am on spring break for the two following weeks, so I will not be able to return to RPI until April 4th. I can't wait to get started on the next phase of my project, which will be the 37C experiment!
Sunday, March 2, 2014
Blocking Buffer Room Temperature Phase
On Friday (February 28th), I finally started my project for real! Today I ran the room temperature phase. At room temperature, Casein and BSA were each blocked for times of 30 minutes, 1 hour, and 2 hours- Casein at 1/2x and 1x and BSA at 0.2, 1, 2.5, and 5%. The slides I ran today are indicated in yellow on the schedule below. I also added a control slide that was blocked with PBS for 2 hours.

My protocol was as follows:
1) Add 1mL of the specified protein solution to the specified slide.
2) Block on the shaker for the specified time.
3) Drain well with pipette into waste container.
4) Wash slide with 4 mL PBS for 5 minutes.
5) Drain well with pipette into waste container.
6) Transfer slide to new plate.
7) Stain with 4 mL blue stain for 15 minutes.
8) Drain stain into waste.
9) Wash slide with 4 mL PBS for 5 minutes.
10) Air dry slides for 5 minutes on paper towel.
11) Write blocking solution, blocking time, and temperature on back of slides.
When staining, the blue dye clotted with 5% BSA blocked for 30 minutes, 5%, 2.5%, and 1% BSA blocked for 1 hour, and 1% BSA blocked for 2 hours. In the future, we will work to find the cause of this clotting.

In this image, the 1 and 2 hour blocking time slides are still blocking with their respective protein solutions (step 2). The 30 minutes blocking time slides are being stained with blue dye (step 7). You can see the clotting of the 5% BSA slide on the far right.
I also had a photographer in the lab today, which added to the excitement of the day! I can't wait to continue my experiment in the coming weeks and begin to analyze the results.
My protocol was as follows:
1) Add 1mL of the specified protein solution to the specified slide.
2) Block on the shaker for the specified time.
3) Drain well with pipette into waste container.
4) Wash slide with 4 mL PBS for 5 minutes.
5) Drain well with pipette into waste container.
6) Transfer slide to new plate.
7) Stain with 4 mL blue stain for 15 minutes.
8) Drain stain into waste.
9) Wash slide with 4 mL PBS for 5 minutes.
10) Air dry slides for 5 minutes on paper towel.
11) Write blocking solution, blocking time, and temperature on back of slides.
When staining, the blue dye clotted with 5% BSA blocked for 30 minutes, 5%, 2.5%, and 1% BSA blocked for 1 hour, and 1% BSA blocked for 2 hours. In the future, we will work to find the cause of this clotting.
In this image, the 1 and 2 hour blocking time slides are still blocking with their respective protein solutions (step 2). The 30 minutes blocking time slides are being stained with blue dye (step 7). You can see the clotting of the 5% BSA slide on the far right.
I also had a photographer in the lab today, which added to the excitement of the day! I can't wait to continue my experiment in the coming weeks and begin to analyze the results.
Sunday, February 23, 2014
Trustee Presentation
On Friday (February 21st), I was again unable to attend my internship because it was the day of the Emma Talks! Emma talks offered a very unique opportunity to hear from six of the most impactful women in the world speaking on topics from the environment, to women in the workplace, to the importance of girls' education.
After the Emma Talks, I had the opportunity to present my own work from my internship to the Board of Trustees! It was a great opportunity to share what we're working on.

I look forward to getting back into the lab this week and starting my blocking buffer experiment!
After the Emma Talks, I had the opportunity to present my own work from my internship to the Board of Trustees! It was a great opportunity to share what we're working on.
I look forward to getting back into the lab this week and starting my blocking buffer experiment!
Sunday, February 16, 2014
Snow Day!
On Friday (February 14th), I was unable to attend my internship because we had a snow day! Instead of any scientific updates, here's a beautiful picture of Emma in snow!

Saturday, February 8, 2014
Testing Dye Binding
Yesterday (February 7th), I continued work on my new project. I ran a preliminary test to confirm the way in which dye binds to slides with PBS and Casein. From this experiment, we expected that the slide incubated with casein would be stained, while the slide incubated with PBS would not. To test this, I incubated one slide with 3 mL of 10X Casein and one slide with 3 mL of PBS for an hour on the shaker. Once the incubation was complete, I drained the solutions into the biologic waste container and washed both of the slides with PBS three times for 10 minutes each time. I then added 3 mL of LabSafe GEL Blue stain onto each slide for 20 minutes.
Once this process was complete, we found a surprising result. The PBS slide, as expected, had not bound the dye. However, the Casein slide did not bind the dye either. Instead, the protein had bound the dye, and the protein was no longer bound to the slide. In the image below, the Casein slide (left) and PBS slide (right) are both pictured with the dye solution still on the slides.

After seeing this result, we decided that either a small amount of Casein was stuck under the slide and came up to bind the dye, preventing us from seeing the protein on the surface of the slide, or the dye eluted the Casein from the slide. In an attempt to see if there was still protein bound to the surface of the slide, I poured the dye off of the slide, washed it with PBS, sprayed it with water, and added 3 mL of dye back onto the slide in a different container. After 10 minutes, the slide showed no change in color, leading us to believe that there was no protein bound to the slide. We will test another Casein slide to see if we get the same result. If the dye is found to elute the Casein from the slide, we will need to reconsider the procedure for my project.
While waiting for the slides in this experiment to incubate, I labeled the trays for my project and prepared my slides by washing them in ethanol.

I look forward to finding out if the dye does indeed elute the Casein from the slides.
Once this process was complete, we found a surprising result. The PBS slide, as expected, had not bound the dye. However, the Casein slide did not bind the dye either. Instead, the protein had bound the dye, and the protein was no longer bound to the slide. In the image below, the Casein slide (left) and PBS slide (right) are both pictured with the dye solution still on the slides.
After seeing this result, we decided that either a small amount of Casein was stuck under the slide and came up to bind the dye, preventing us from seeing the protein on the surface of the slide, or the dye eluted the Casein from the slide. In an attempt to see if there was still protein bound to the surface of the slide, I poured the dye off of the slide, washed it with PBS, sprayed it with water, and added 3 mL of dye back onto the slide in a different container. After 10 minutes, the slide showed no change in color, leading us to believe that there was no protein bound to the slide. We will test another Casein slide to see if we get the same result. If the dye is found to elute the Casein from the slide, we will need to reconsider the procedure for my project.
While waiting for the slides in this experiment to incubate, I labeled the trays for my project and prepared my slides by washing them in ethanol.
I look forward to finding out if the dye does indeed elute the Casein from the slides.
Saturday, February 1, 2014
First Step: Blocking Buffer Solutions
On Friday (January 31st), I worked on the first steps of my new blocking buffer project! Because I did not specifically explain the purpose of a blocking buffer in my previous posts, blocking buffers are used to prevent nonspecific binding, reduce background signal, and stabilize proteins for better interactions. These effects are demonstrated in the following image.
Today I took my first step in my project by making my blocking buffer solutions! We decided to make 5 mL of each BSA solution (5%, 2.5%, 1%, 0.2%) and 10 mL of each Casein solution (1x and 1/2x). First, I had to do the calculations to determine the amounts of the buffers and the amounts of PBS that I would need for the dilutions. First, I would make the highest concentration solution and dilute from that. Below are my calculations.

Once the calculations were confirmed, I completed the dilutions. I have now officially started my own project! I can't wait to carry out this experiment!
 |
| Image from http://www.immunochemistry.com/products/elisa-solutions-1/blocking-buffers.html |
Today I took my first step in my project by making my blocking buffer solutions! We decided to make 5 mL of each BSA solution (5%, 2.5%, 1%, 0.2%) and 10 mL of each Casein solution (1x and 1/2x). First, I had to do the calculations to determine the amounts of the buffers and the amounts of PBS that I would need for the dilutions. First, I would make the highest concentration solution and dilute from that. Below are my calculations.
Once the calculations were confirmed, I completed the dilutions. I have now officially started my own project! I can't wait to carry out this experiment!
Sunday, January 26, 2014
Blocking Buffer Project Introduction
On Friday (January 24th), I worked on planning my project for the Spring semester. I will be testing concentrations of blocking buffers and the time and temperature used for blocking. In my experiments, I will be testing two popular blocking buffers: Bovine Serum Albumin (BSA) and Casein. In my research last week, I found that the concentrations of BSA used in research procedures are usually between 0.2% and 5%, and concentrations of Casein are usually between 1/2x and 1x. Using this information, I decided on a project plan that analyzes 0.2, 1, 2.5, and 5% concentrations of BSA and 1/2x and 1x concentrations of Casein. I will be testing the BSA concentrations at room temperature for blocking times of 30 minutes, 1 hour, and 2 hours, and at 4˚C blocked overnight. I will be testing the Casein concentrations at room temperature and 37˚C for blocking times of 30 minutes, 1 hour, and 2 hours, and at 4˚C overnight. Below shows my initial tables for the project. The last table indicates how many slides I will need for each temperature for each blocking buffer.

Overall, my goal is to determine the least amount of blocking buffer and the least amount of blocking time that will be effective in blocking the slides. I will collect quantitative data by examining the intensity of fluorescence that results on each slide when each slide is coated with SYPRO dye. Last week, I determined that the SYPRO dye has a pH of 5. This acidity could cause the SYPRO dye to elute protein off of the slides. Ideally, we would like to raise the pH of the dye to 7.4. However, raising the pH can cause the dye to fall out of solution and form a solid.
Today, I tested the pH that I could raise the SYPRO dye to before it fell out of the solution. To do this, I tested a 1 mL sample of the dye, adding 1 µL of 2M NaOH at a time and spinning the sample down for 1 minutes to observe if any solid formed.
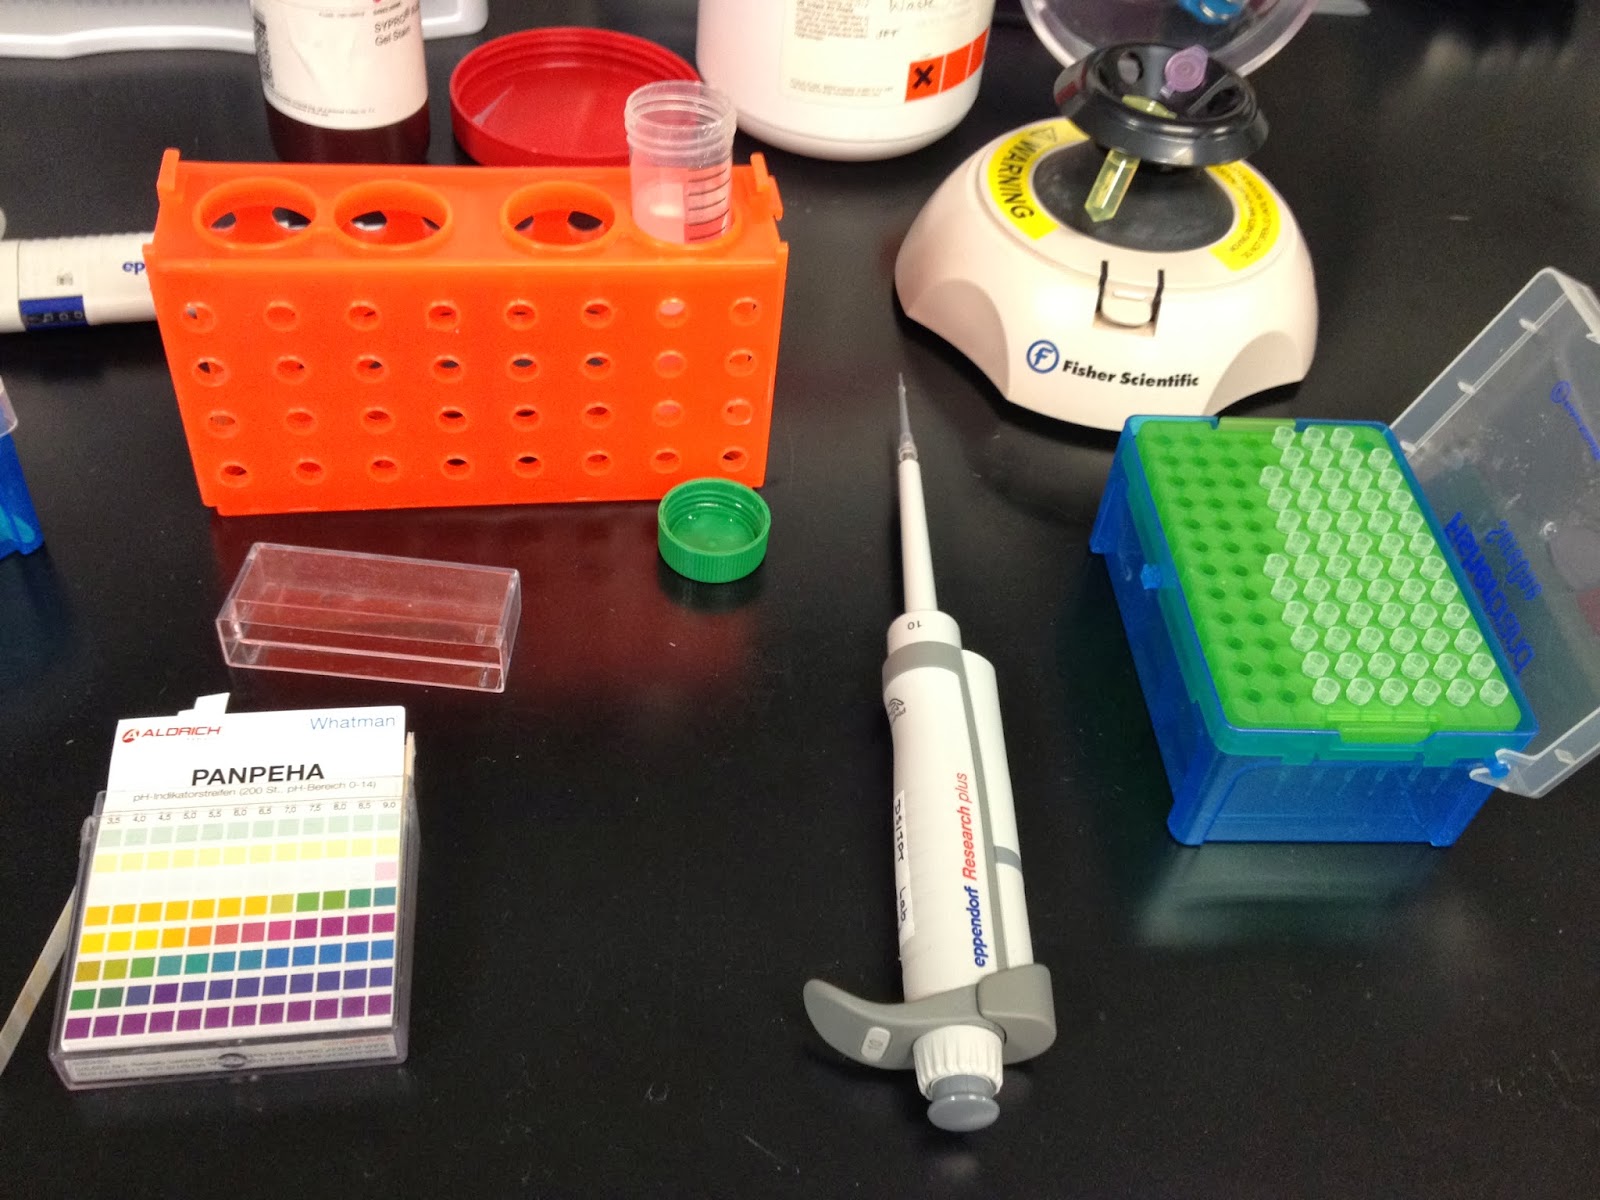
Once I observed a clear, jellylike solid substance forming from the solution, I used pH strips to test the pH of the solution, which I found to be around 6. I then continued to raise the pH of the dye to pH 10 to see if there were any other effects of increasing the pH. I found that there were no effects other than a clear, jelly-like substance forming at the bottom of the sample. We then wanted to know if any of the dye stayed in the solution. To do this, I took small samples of the original dye, the supernatant that was left after I spun down the sample, and the jelly-like substance. JP and I then observed these samples under UV light to observe the fluorescence of the dye. We found that both the jelly-like substance and the supernatant were about half as fluorescent as the original dye.
I can't wait to continue developing the details of my project next week!
Overall, my goal is to determine the least amount of blocking buffer and the least amount of blocking time that will be effective in blocking the slides. I will collect quantitative data by examining the intensity of fluorescence that results on each slide when each slide is coated with SYPRO dye. Last week, I determined that the SYPRO dye has a pH of 5. This acidity could cause the SYPRO dye to elute protein off of the slides. Ideally, we would like to raise the pH of the dye to 7.4. However, raising the pH can cause the dye to fall out of solution and form a solid.
Today, I tested the pH that I could raise the SYPRO dye to before it fell out of the solution. To do this, I tested a 1 mL sample of the dye, adding 1 µL of 2M NaOH at a time and spinning the sample down for 1 minutes to observe if any solid formed.
Once I observed a clear, jellylike solid substance forming from the solution, I used pH strips to test the pH of the solution, which I found to be around 6. I then continued to raise the pH of the dye to pH 10 to see if there were any other effects of increasing the pH. I found that there were no effects other than a clear, jelly-like substance forming at the bottom of the sample. We then wanted to know if any of the dye stayed in the solution. To do this, I took small samples of the original dye, the supernatant that was left after I spun down the sample, and the jelly-like substance. JP and I then observed these samples under UV light to observe the fluorescence of the dye. We found that both the jelly-like substance and the supernatant were about half as fluorescent as the original dye.
I can't wait to continue developing the details of my project next week!
Tuesday, January 21, 2014
Lyophilization
Last Friday (January 17th), I returned to RPI to work more with samples from a peptide synthesis. Today, we went through the process of lyophilization, also known as freeze-drying. The peptide samples were from a synthesis that JP completed earlier, which were already frozen in the freezer. To prepare the peptides for lyophilization, we used liquid nitrogen to freeze the peptides and then covered the tubes with both parafilm and foil. We had to poke holes in the foil and parafilm with a thumbtack for the process to work properly. In the process of lyophilization, we use a machine like the one shown below.

In the process of lyophilization, the peptide tubes are placed in a canister that attaches to one of the spouts of the machine. Inside the center pole of the machine, there is an extremely cold coil that's even colder than the liquid nitrogen. This machine applies both force and extremely cold temperatures to the peptides. As the peptides slowly melt, the pressure causes the water vapor to be transferred to the colder coil, where it condenses. After two or three days, this process eventually removes all of the water from the peptide samples, leaving them freeze-dried with the appearance like a dried sponge or old chewing gum. Lyophilization allows us to turn the peptide samples into a powder, which will be used in future experiments with our synthesized peptides.
Today, we also discussed possible topics for a my own research project. My project will likely have to do with testing blocking buffer solutions. My first task was to check the pH of SYPRO protein gel stain to make sure it's not too acidic to use with peptide microarrays. Using pH strips, I found the pH to be approximately 5.

I will provide more details of my project in coming weeks. This week, I am tasked with researching details about different blocking buffer solutions that are currently in use. I can't wait to establish the objectives of my project!
In the process of lyophilization, the peptide tubes are placed in a canister that attaches to one of the spouts of the machine. Inside the center pole of the machine, there is an extremely cold coil that's even colder than the liquid nitrogen. This machine applies both force and extremely cold temperatures to the peptides. As the peptides slowly melt, the pressure causes the water vapor to be transferred to the colder coil, where it condenses. After two or three days, this process eventually removes all of the water from the peptide samples, leaving them freeze-dried with the appearance like a dried sponge or old chewing gum. Lyophilization allows us to turn the peptide samples into a powder, which will be used in future experiments with our synthesized peptides.
Today, we also discussed possible topics for a my own research project. My project will likely have to do with testing blocking buffer solutions. My first task was to check the pH of SYPRO protein gel stain to make sure it's not too acidic to use with peptide microarrays. Using pH strips, I found the pH to be approximately 5.
I will provide more details of my project in coming weeks. This week, I am tasked with researching details about different blocking buffer solutions that are currently in use. I can't wait to establish the objectives of my project!
Saturday, January 11, 2014
Work-Up
Yesterday, (January 10th), I went to RPI for my first research day of the second semester! I worked on a work up of the peptide synthesis I helped prep for in December. First, I swelled the pellets with ethanol to re-saturate them. Then, I washed each well with TFA:DCM using a step pipette to remove blocking groups. This was the first time I've ever used a step pipette! It dispenses a specified amount of liquid without exposing the inside of the pipette to caustic chemicals such as TFA:DCM.

After TFA:DCM was added to each well, I waited 30 minutes for it to drain, then repeated the TFA:DCM wash process two more times. While I waited for the TFA:DCM to drain, I washed slides in ethanol and made 100mL of 20% ethanol.
After the TFA:DCM drained, I washed the wells with DMF three times to remove the TFA:DCM. I then hooked the well plate up to a vacuum and used the vacuum to drain the plate as I washed the wells with ethanol three more times to remove any remaining TFA:DCM and DMF.
Once the washes were complete, I added ethanol to the bottom of the wells as well as on top, so the peptides are kept in ethanol until they are needed.

I can't wait to return and continue my work!
After TFA:DCM was added to each well, I waited 30 minutes for it to drain, then repeated the TFA:DCM wash process two more times. While I waited for the TFA:DCM to drain, I washed slides in ethanol and made 100mL of 20% ethanol.
After the TFA:DCM drained, I washed the wells with DMF three times to remove the TFA:DCM. I then hooked the well plate up to a vacuum and used the vacuum to drain the plate as I washed the wells with ethanol three more times to remove any remaining TFA:DCM and DMF.
Once the washes were complete, I added ethanol to the bottom of the wells as well as on top, so the peptides are kept in ethanol until they are needed.
I can't wait to return and continue my work!
Friday, December 13, 2013
Prepping for Peptide Synthesis
Today, (December 13th), I went to RPI for my final research day of the first semester! Today I worked on prepping for another peptide synthesis. We are working to attach a peptide to a new linker that attaches to a resin bead. The concept is similar to another idea that I introduced in a previous post. These beads will eventually be packed into a column and used to purify biologics with the binding of the peptides on the beads.
My first job was to make 25 mL of 0.1 M NaOH from 2 M NaOH. Using the formula (M1)(V1)=(M2)(V2), I found that I would need to add 1.25 mL of 2 M NaOH and fill the rest of the volume with PBS. To carry out the dilution, I used a volumetric flask.

Next, I made 50 mL of 20% ethanol solution. To do this, I added 10 mL of ethanol to 40 mL of distilled water. After I mixed this solution, I then added 150 microliters to each of 20 wells in a well plate. After waiting for half an hour for the ethanol solution to evaporate, I added 150 more microliters to each well.

I can't believe that the first semester of my senior year is already over! I can't wait to see what's in store for me starting in January.

My first job was to make 25 mL of 0.1 M NaOH from 2 M NaOH. Using the formula (M1)(V1)=(M2)(V2), I found that I would need to add 1.25 mL of 2 M NaOH and fill the rest of the volume with PBS. To carry out the dilution, I used a volumetric flask.

Next, I made 50 mL of 20% ethanol solution. To do this, I added 10 mL of ethanol to 40 mL of distilled water. After I mixed this solution, I then added 150 microliters to each of 20 wells in a well plate. After waiting for half an hour for the ethanol solution to evaporate, I added 150 more microliters to each well.


Sunday, December 8, 2013
New Microarray Experiment
On Friday (December 6th), I finally returned to RPI! JP explained to me a new experiment that we're running. We are now running a microarray to analyze the binding of HCP proteins that we do not want to bind to the biologic that we are creating. This information will be used in the purification work I described in an earlier post.
Today, most of my time was spent waiting for the microarray slides to incubate (they had to incubate for an entire two hours!). While I waited, Doug and I adjusted the pH of the PBS he was making using a 1M NaOH solution to increase the pH to 5.5. I then labeled the tubes for HCP and PBS solutions and the petri dishes containing the slides that would eventually be used with those solutions. Some tubes would contain 1 mL of PBS, some would contain 1 mL of HCP solution, and some would contain a mixture of half PBS and half HCP solution. After I finished labeling, I added the indicated amounts of PBS and HCP solution to the tubes.
After the tubes were all filled, Doug and I made amino acid solutions. After some practice, I'm definitely getting faster at weighing out the amino acids!

When the slides were finally done incubating, we washed them three times with the new PBS solution for 10 minutes per wash. By the time the washes were over, it was time for me to go back to Emma!
I can't wait to return to RPI next week for my last visit of the semester and see the results of this experiment!
Today, most of my time was spent waiting for the microarray slides to incubate (they had to incubate for an entire two hours!). While I waited, Doug and I adjusted the pH of the PBS he was making using a 1M NaOH solution to increase the pH to 5.5. I then labeled the tubes for HCP and PBS solutions and the petri dishes containing the slides that would eventually be used with those solutions. Some tubes would contain 1 mL of PBS, some would contain 1 mL of HCP solution, and some would contain a mixture of half PBS and half HCP solution. After I finished labeling, I added the indicated amounts of PBS and HCP solution to the tubes.
After the tubes were all filled, Doug and I made amino acid solutions. After some practice, I'm definitely getting faster at weighing out the amino acids!

When the slides were finally done incubating, we washed them three times with the new PBS solution for 10 minutes per wash. By the time the washes were over, it was time for me to go back to Emma!
I can't wait to return to RPI next week for my last visit of the semester and see the results of this experiment!
Sunday, December 1, 2013
Scanning Slides
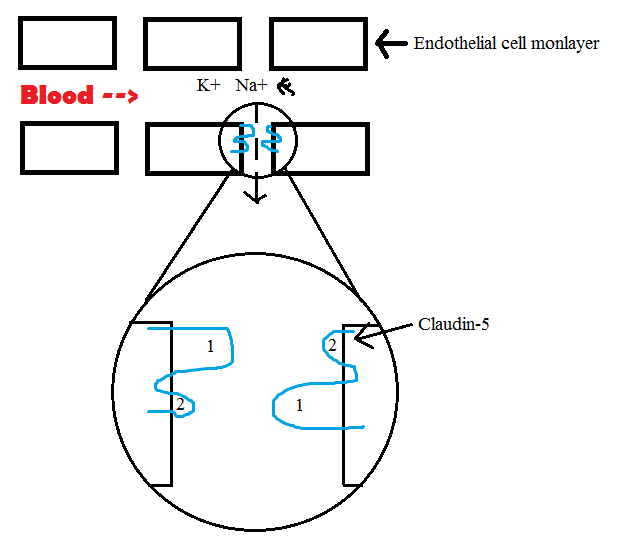
Last Friday (November 22nd), I returned to RPI for more work! Currently, we have three methods of getting the protein that we are focusing on. The first method involves growing the protein in E-coli and lysing the cells. The other two methods involve extracting the protein from human brain cells using different buffers (which I will call buffer R and buffer T). As I have demonstrated in previous posts, our protein consists of two loops that react with each other to form a tight junction.

In all of our previous experiments, we have used only parts of the protein in microarray experiments. Today, we analyzed microarray slides that tested the entirety of the protein for the first time. We used a scanner to analyze slides that tested protein derived from each of the three methods. We scanned nine slides total. 100%, 50%, 10%, and 1% dilution for the E.Coli protein, 50% and 10% dilution for the buffer R protein, and 50% and 10% dilution for the buffer T protein. We scanned each group separately for comparison. With each group, we also scanned a control slide which consisted of no focus protein- only primary antibody- to make sure the antibody was binding specifically to the focus protein. Examples of good and bad binding of the primary antibody are seen below. The blue circles represent focus protein that was bound to the microarray, and the red represents primary antibody. We want the primary antibody to bind only to the focus protein.


.png)
In all of our previous experiments, we have used only parts of the protein in microarray experiments. Today, we analyzed microarray slides that tested the entirety of the protein for the first time. We used a scanner to analyze slides that tested protein derived from each of the three methods. We scanned nine slides total. 100%, 50%, 10%, and 1% dilution for the E.Coli protein, 50% and 10% dilution for the buffer R protein, and 50% and 10% dilution for the buffer T protein. We scanned each group separately for comparison. With each group, we also scanned a control slide which consisted of no focus protein- only primary antibody- to make sure the antibody was binding specifically to the focus protein. Examples of good and bad binding of the primary antibody are seen below. The blue circles represent focus protein that was bound to the microarray, and the red represents primary antibody. We want the primary antibody to bind only to the focus protein.

For the scan, I laid each slide face down on the scanner, each oriented the same direction. I had to be careful to line them up straight right along the edge of the scanner, so later analysis using spotfinder would be easier to line up the microarray spots.

An example slide arrangement is seen below for the E.coli slides.
.png)
We scanned the slides first at 200 microns, then at 50 to get the most precise scan possible. After getting the images from the scanner, we imported them into a program called spotfinder to analyze the intensity of each spot. The resulting data wasn't perfect, but it was a good start!
I will not be able to go to RPI next Friday (November 29th) due to the Thanksgiving holiday, but I look forward to returning on December 6th!
Saturday, November 9, 2013
Microscopy!
Today (November 8th), we worked with cells from the blood-brain barrier using microscopy! By definition, microscopy is "investigation using a microscope." To refresh my knowledge of the microscopy processes we use, JP gave me this link to read. In our work, we used Alexa 488 and Hoechst 33342 (also known as DAPI). Before I arrived, JP fixed the cells and added the primary antibody. We had to decide whether or not to permeablize the cells before adding the DAPI. We decided to try imaging the cells without permeablization first. We added a DAPI solution to the sample, incubated the cells, and then removed the excess solution. We then washed the sample a couple times to remove excess dye.
Once the sample was ready to be imaged, we had to decide what wavelengths of lasers to use to image them. To do this, we used a program called SpectraViewer. The resulting graphs are shown below.

 The vertical line on the graphs represents the wavelength of the selected laser. The green curve represents the Hoechst 33342 and the red curve represents the Alexa 488. The shaded regions represent the region that will be recorded. We decided to use the 405 nm laser for the Hoechst 33342 and the 488 nm laser for the Alexa 488.
To image the cells, we used a Zeiss Spectral Confocal Microscope (seen in the image below). It was so cool to be able to see the cells magnified to such a high degree!

The nuclei were very clearly visible, but the staining from the Hoechst 33342 was not visible. After viewing the images, we decided that it would be necessary to permeabilize the cells and re-add the Hoechst.
I won't be able to go to RPI next week because I will be in Kansas City for my national championship horse show, but I can't wait to return on the 22nd to see the images from the cells and continue our work!
Once the sample was ready to be imaged, we had to decide what wavelengths of lasers to use to image them. To do this, we used a program called SpectraViewer. The resulting graphs are shown below.


To image the cells, we used a Zeiss Spectral Confocal Microscope (seen in the image below). It was so cool to be able to see the cells magnified to such a high degree!

The nuclei were very clearly visible, but the staining from the Hoechst 33342 was not visible. After viewing the images, we decided that it would be necessary to permeabilize the cells and re-add the Hoechst.
I won't be able to go to RPI next week because I will be in Kansas City for my national championship horse show, but I can't wait to return on the 22nd to see the images from the cells and continue our work!
Sunday, November 3, 2013
Analyzing Peptide Mapping Data
On Friday (November 1st), I did a lot of work with analyzing peptide mapping data using the Origin program. But before I get into that, JP said that the peptide formation that I prepped for last week came out perfect! Anyway, I worked with three different sets of data from the same experiment- one set of 20 peptides and two sets of 56. After copying the data from a previous Excel sheet, my first step was to change the settings of all of the odd-numbered columns to "Y-error" because it represented standard deviation data. After I had done that for all three sets of data, I adjusted the fit curves by using a one-site bind pharmacology non-linear cure fit. In that process, I had to change the k-values of every data set to 1 to standardize the fits.

Our goal is to look at the data for each of the peptides and determine which peptides have low Kd (affinity towards the substrate) values and high R-squared values (good fit to the best-fit line). The area we are looking for is represented by the green area above. In looking at the plots, I narrowed the range to an R-squared value of 0.5 to 1 and Kd value of 3E-6 to 8E-6, and changed the data point labels to display their peptide numbers. Looking at the layout of peptides in this region, we determined that the most accurate set of data is the second set of 56, which makes sense because those peptides were made in 2012, while the peptides used in the other two sets were made in 2011.
After looking at those plots, I the plotted Peptide # vs. 1/Kd. This produced plots with many sporadic troughs and peaks. JP introduced me to the idea of curve-smoothing. Using the Kd values of the peptides, we are ideally looking for the Kd values of individual amino acids. To do this, we use averages of the Kd values of different peptides. For example, A would equal KD1, B would equal the average of KD1 and KD2, etc.

Using an Excel template that JP made for a previous experiment, I plotted averages of three up to fifteen peptides. While the fifteen-peptide averages obviously smoothed the curve the most, it is hard to determine the correct plot we should use because as the curve gets smoother, it hides certain important peaks.
After I finished my analysis work, JP showed me some of the brain cells that he is culturing! He just started growing them on Tuesday, so they had not yet grown into a full layer of cells. They will be used to run a second trial of an experiment we did last winter, which involves testing the permeability of the blood-brain barrier by passing different sizes of sugar molecules through a layer of cells. I can't wait to continue working with the data and see where that experiment goes!

After looking at those plots, I the plotted Peptide # vs. 1/Kd. This produced plots with many sporadic troughs and peaks. JP introduced me to the idea of curve-smoothing. Using the Kd values of the peptides, we are ideally looking for the Kd values of individual amino acids. To do this, we use averages of the Kd values of different peptides. For example, A would equal KD1, B would equal the average of KD1 and KD2, etc.
Using an Excel template that JP made for a previous experiment, I plotted averages of three up to fifteen peptides. While the fifteen-peptide averages obviously smoothed the curve the most, it is hard to determine the correct plot we should use because as the curve gets smoother, it hides certain important peaks.
After I finished my analysis work, JP showed me some of the brain cells that he is culturing! He just started growing them on Tuesday, so they had not yet grown into a full layer of cells. They will be used to run a second trial of an experiment we did last winter, which involves testing the permeability of the blood-brain barrier by passing different sizes of sugar molecules through a layer of cells. I can't wait to continue working with the data and see where that experiment goes!
Monday, October 28, 2013
Purification Experiment Set-Up
Last Friday (October 25th), JP introduced me to another project that our lab is working on. Previously, we had two different ways to produce free peptide. First, we could grow peptides off cellulose and dissolve the cellulose in DMSO to leave the free pepide in solution. Second, we could grow peptides off of a polymer bead that has functional groups for the peptide to attach to. These linkers could then be cut using a strong acid to produce free peptide. Now, we are working on producing peptide that grows directly off of the polymer bead, so it cannot be cleaved. Using these beads in a column, we could purify biologic. When biologic is entered into the top of the column, it would be captured by the column through the peptides. We could then elute off the biologic.

To prep for this experiment, I inserted seven specific amino acid sequences into the peptide machine program, copying each 13 times. After inserting the sequences, I used the program to see what volume of each amino acid prepped amino acids for the peptide machine. I then rounded those values up to either 5, 10, or 15 mL of solution. After determining the amount of each solution we would need, I calculated the gram amount of amino acid and mL amount of NMT to be added to make each solution. I then labeled each amino acid tube and added the specified grams of amino acid to each.
We will use the amino acid solutions that I made today to produce the seven specified peptides that I entered into the program. I look forward to returning to RPI next Friday to see what progress has been made!

To prep for this experiment, I inserted seven specific amino acid sequences into the peptide machine program, copying each 13 times. After inserting the sequences, I used the program to see what volume of each amino acid prepped amino acids for the peptide machine. I then rounded those values up to either 5, 10, or 15 mL of solution. After determining the amount of each solution we would need, I calculated the gram amount of amino acid and mL amount of NMT to be added to make each solution. I then labeled each amino acid tube and added the specified grams of amino acid to each.
We will use the amino acid solutions that I made today to produce the seven specified peptides that I entered into the program. I look forward to returning to RPI next Friday to see what progress has been made!
Subscribe to:
Posts (Atom)